|

|
PreCalculus Blog #1- Raising the Flag Graphs
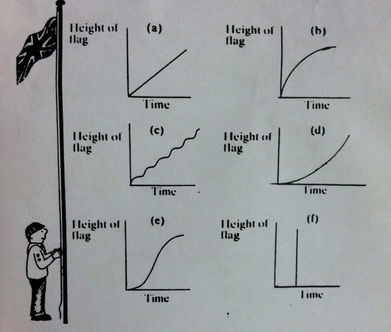
1. Graph A: The boy hoisting the flag hoisted it in an even and linear fashion, keeping the progressing height of the flag even with the amount of time passed.
Graph B: The boy was able to hoist the flag very quickly starting out, then began to slowly advance the height and eventually plateaued the flag's progression to a halt.
Graph C: The boy struggled to get the flag up over time, to where it bobbed up and down as it climbed to the top.
Graph D: The boy had trouble getting the flag up towards the beginning, then was able to hoist the flag to the top as time progressed.
Graph E: Towards the middle of his time lifting the flag, the boy was able to lift the flag very quickly in a short period of time.
Graph F: In the middle of time spent lifting the flag, the boy lifted it to the top almost instantly.
2. To me, the most accurate graph pictured in the image is the Graph C. This is because, in all instances where I have seen a flag being hoisted up a flagpole, people usually raise it in small tugs. Especially for a boy this young, it would take a great deal of effort for him to consistently raise the flag to where it just rises to the top, whether or not it is hoisted rather quickly starting out or rather slowly starting out. Realistically speaking, the youngest boy in camp tasked with raising the flag would raise it slowly and in small tugs, which would cause the height of the flag to bob up and down, as the Graph C clearly shows. This most likely would've been the case for a situation like this in real life.
3. The most unrealistic graph pictured is clearly Graph F. For a boy as young as he is, raising the flag in an instant would be almost impossible. It may be impossible for a regular, grown human being. Perhaps someone with way more strength and age than the boy pictured might be able to hoist the flag as quickly as Graph F shows. But for the youngest boy at the summer camp, it wouldn't be so likely at all, despite how strong the boy pictured could be.
